


PHP Veriye Göre Tablo Şekli |
9 Mesajlar | 1.939 Okunma | ||
Toplam 9 mesaj ve 1.939 görüntüleme

- Üyelik 10.02.2018
- Yaş/Cinsiyet 26 / E
- Meslek Back-End ve Siber Güvenlik
- Konum İstanbul Avrupa
- Ad Soyad F** G**
- Mesajlar 101
- Beğeniler 11 / 1
- Ticaret 0, (%0)
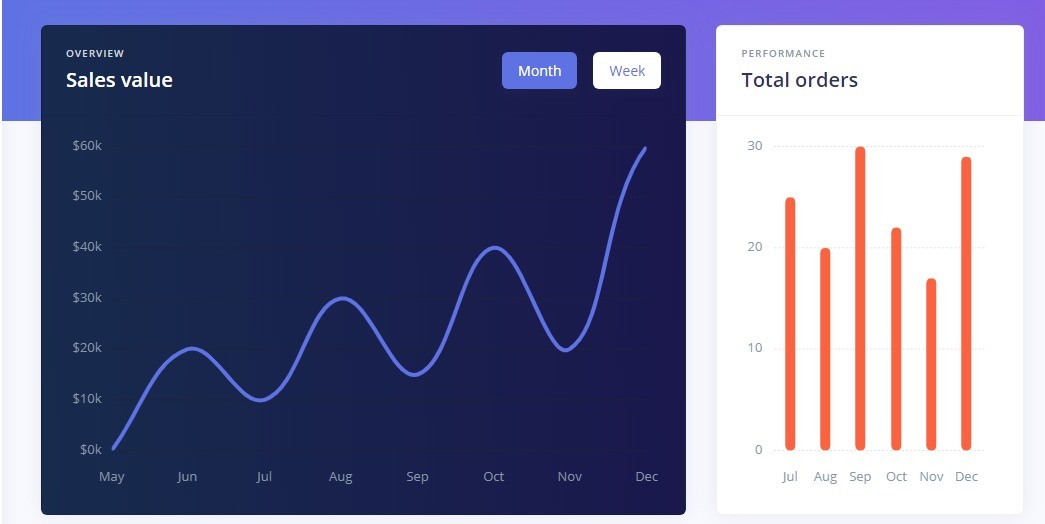
Başlık biraz karmaşık olabilir tam olarak yapmak istediğim şey aşağıda resmi olan tabloyu veriye göre hareketlendirmek istiyorum.


- Üyelik 11.05.2013
- Yaş/Cinsiyet - /
- Meslek
- Konum
- Ad Soyad ** **
- Mesajlar 3142
- Beğeniler 60 / 764
- Ticaret 5, (%100)
Resimde kullanılan kütüphaneyi bilmiyorum. O kütüphaneyi bulup dökümantasyonuna bakman gerekiyor.
- Üyelik 10.02.2018
- Yaş/Cinsiyet 26 / E
- Meslek Back-End ve Siber Güvenlik
- Konum İstanbul Avrupa
- Ad Soyad F** G**
- Mesajlar 101
- Beğeniler 11 / 1
- Ticaret 0, (%0)
Tablo tasarımdan ibaret herhangi bir yazılım yok içerisinde
- Üyelik 26.05.2018
- Yaş/Cinsiyet 31 / E
- Meslek Öğrenci
- Konum Muğla
- Ad Soyad A** Y**
- Mesajlar 99
- Beğeniler 23 / 19
- Ticaret 2, (%50)
Yardımcı olabilirim özel mesaj atarsanız

- Üyelik 14.01.2018
- Yaş/Cinsiyet 53 / E
- Meslek Programcı
- Konum İzmir
- Ad Soyad S** S**
- Mesajlar 319
- Beğeniler 4 / 111
- Ticaret 0, (%0)
Bunu javascript kütüphaneleri ile yapabilirsin.
Ancak profesyonel yardım alman daha doğru sanki.
Ancak profesyonel yardım alman daha doğru sanki.
- Üyelik 10.02.2018
- Yaş/Cinsiyet 26 / E
- Meslek Back-End ve Siber Güvenlik
- Konum İstanbul Avrupa
- Ad Soyad F** G**
- Mesajlar 101
- Beğeniler 11 / 1
- Ticaret 0, (%0)
Tekrardan merhabalar,
Eve geldim ve biraz kurcaladıktan sonra şunları gördüm;
Chart kullanılıyor fakat chart'ın script kodları kendi yazdıkları .js dosyasında.
Ben şöyle bir şey yapmak istiyorum;
PHP Yoluyla mysql sorgulama yapılsın ve tablonun bir sütunundaki verilerin toplamı oraya yazılsın. ( Kırmızı renkteki işlemi nasıl yapacağımı biliyorum oraya çok takılmayın.
Bunu nasıl yapabilirim?
Yani yapmak istediğim şey;
xxx.js içerisinde PHP kodu çalıştırmak
- Üyelik 14.01.2018
- Yaş/Cinsiyet 53 / E
- Meslek Programcı
- Konum İzmir
- Ad Soyad S** S**
- Mesajlar 319
- Beğeniler 4 / 111
- Ticaret 0, (%0)
Yani en azından bir link ver deki şu kütüphaneyi kullanıyorlar nasıl uygularım diye sor.
Şimdi o kullandığın kütüphanenin bir kurulum sistemi vardır.
xyz.js yi sayfa başlığına (eğer anlıyorsan bu işlerden sonuna) eklersin.
sonra o kutuphanenin. setup şeysi vardır.
veriyi php den getirip oraya gömersin.
sonra onu bu kütüphanenin başlatıcı fonksiyonunu bu data ile birlikte çağırırsın olur biter.
Bak mesela
https://adminlte.io/themes/AdminLTE/pages/charts/chartjs.html
Gibi
Şimdi o kullandığın kütüphanenin bir kurulum sistemi vardır.
xyz.js yi sayfa başlığına (eğer anlıyorsan bu işlerden sonuna) eklersin.
sonra o kutuphanenin. setup şeysi vardır.
veriyi php den getirip oraya gömersin.
sonra onu bu kütüphanenin başlatıcı fonksiyonunu bu data ile birlikte çağırırsın olur biter.
Bak mesela
https://adminlte.io/themes/AdminLTE/pages/charts/chartjs.html
$(function () {
/* ChartJS
* -------
* Here we will create a few charts using ChartJS
*/
//--------------
//- AREA CHART -
//--------------
// Get context with jQuery - using jQuery's .get() method.
var areaChartCanvas = $('#areaChart').get(0).getContext('2d')
// This will get the first returned node in the jQuery collection.
var areaChart = new Chart(areaChartCanvas)
var areaChartData = {
labels : ['January', 'February', 'March', 'April', 'May', 'June', 'July'],
datasets: [
{
label : 'Electronics',
fillColor : 'rgba(210, 214, 222, 1)',
strokeColor : 'rgba(210, 214, 222, 1)',
pointColor : 'rgba(210, 214, 222, 1)',
pointStrokeColor : '#c1c7d1',
pointHighlightFill : '#fff',
pointHighlightStroke: 'rgba(220,220,220,1)',
data : [65, 59, 80, 81, 56, 55, 40]
},
{
label : 'Digital Goods',
fillColor : 'rgba(60,141,188,0.9)',
strokeColor : 'rgba(60,141,188,0.8)',
pointColor : '#3b8bba',
pointStrokeColor : 'rgba(60,141,188,1)',
pointHighlightFill : '#fff',
pointHighlightStroke: 'rgba(60,141,188,1)',
data : [28, 48, 40, 19, 86, 27, 90]
}
]
}
var areaChartOptions = {
//Boolean - If we should show the scale at all
showScale : true,
//Boolean - Whether grid lines are shown across the chart
scaleShowGridLines : false,
//String - Colour of the grid lines
scaleGridLineColor : 'rgba(0,0,0,.05)',
//Number - Width of the grid lines
scaleGridLineWidth : 1,
//Boolean - Whether to show horizontal lines (except X axis)
scaleShowHorizontalLines: true,
//Boolean - Whether to show vertical lines (except Y axis)
scaleShowVerticalLines : true,
//Boolean - Whether the line is curved between points
bezierCurve : true,
//Number - Tension of the bezier curve between points
bezierCurveTension : 0.3,
//Boolean - Whether to show a dot for each point
pointDot : false,
//Number - Radius of each point dot in pixels
pointDotRadius : 4,
//Number - Pixel width of point dot stroke
pointDotStrokeWidth : 1,
//Number - amount extra to add to the radius to cater for hit detection outside the drawn point
pointHitDetectionRadius : 20,
//Boolean - Whether to show a stroke for datasets
datasetStroke : true,
//Number - Pixel width of dataset stroke
datasetStrokeWidth : 2,
//Boolean - Whether to fill the dataset with a color
datasetFill : true,
//String - A legend template
legendTemplate : '<% for (var i=0; i- <%if(datasets[i].label){%><%=datasets[i].label%><%}%>
<%}%>
',
//Boolean - whether to maintain the starting aspect ratio or not when responsive, if set to false, will take up entire container
maintainAspectRatio : true,
//Boolean - whether to make the chart responsive to window resizing
responsive : true
}
//Create the line chart
areaChart.Line(areaChartData, areaChartOptions)
//-------------
//- LINE CHART -
//--------------
var lineChartCanvas = $('#lineChart').get(0).getContext('2d')
var lineChart = new Chart(lineChartCanvas)
var lineChartOptions = areaChartOptions
lineChartOptions.datasetFill = false
lineChart.Line(areaChartData, lineChartOptions)
//-------------
//- PIE CHART -
//-------------
// Get context with jQuery - using jQuery's .get() method.
var pieChartCanvas = $('#pieChart').get(0).getContext('2d')
var pieChart = new Chart(pieChartCanvas)
var PieData = [
{
value : 700,
color : '#f56954',
highlight: '#f56954',
label : 'Chrome'
},
{
value : 500,
color : '#00a65a',
highlight: '#00a65a',
label : 'IE'
},
{
value : 400,
color : '#f39c12',
highlight: '#f39c12',
label : 'FireFox'
},
{
value : 600,
color : '#00c0ef',
highlight: '#00c0ef',
label : 'Safari'
},
{
value : 300,
color : '#3c8dbc',
highlight: '#3c8dbc',
label : 'Opera'
},
{
value : 100,
color : '#d2d6de',
highlight: '#d2d6de',
label : 'Navigator'
}
]
var pieOptions = {
//Boolean - Whether we should show a stroke on each segment
segmentShowStroke : true,
//String - The colour of each segment stroke
segmentStrokeColor : '#fff',
//Number - The width of each segment stroke
segmentStrokeWidth : 2,
//Number - The percentage of the chart that we cut out of the middle
percentageInnerCutout: 50, // This is 0 for Pie charts
//Number - Amount of animation steps
animationSteps : 100,
//String - Animation easing effect
animationEasing : 'easeOutBounce',
//Boolean - Whether we animate the rotation of the Doughnut
animateRotate : true,
//Boolean - Whether we animate scaling the Doughnut from the centre
animateScale : false,
//Boolean - whether to make the chart responsive to window resizing
responsive : true,
// Boolean - whether to maintain the starting aspect ratio or not when responsive, if set to false, will take up entire container
maintainAspectRatio : true,
//String - A legend template
legendTemplate : '<% for (var i=0; i- <%if(segments[i].label){%><%=segments[i].label%><%}%>
<%}%>
'
}
//Create pie or douhnut chart
// You can switch between pie and douhnut using the method below.
pieChart.Doughnut(PieData, pieOptions)
//-------------
//- BAR CHART -
//-------------
var barChartCanvas = $('#barChart').get(0).getContext('2d')
var barChart = new Chart(barChartCanvas)
var barChartData = areaChartData
barChartData.datasets[1].fillColor = '#00a65a'
barChartData.datasets[1].strokeColor = '#00a65a'
barChartData.datasets[1].pointColor = '#00a65a'
var barChartOptions = {
//Boolean - Whether the scale should start at zero, or an order of magnitude down from the lowest value
scaleBeginAtZero : true,
//Boolean - Whether grid lines are shown across the chart
scaleShowGridLines : true,
//String - Colour of the grid lines
scaleGridLineColor : 'rgba(0,0,0,.05)',
//Number - Width of the grid lines
scaleGridLineWidth : 1,
//Boolean - Whether to show horizontal lines (except X axis)
scaleShowHorizontalLines: true,
//Boolean - Whether to show vertical lines (except Y axis)
scaleShowVerticalLines : true,
//Boolean - If there is a stroke on each bar
barShowStroke : true,
//Number - Pixel width of the bar stroke
barStrokeWidth : 2,
//Number - Spacing between each of the X value sets
barValueSpacing : 5,
//Number - Spacing between data sets within X values
barDatasetSpacing : 1,
//String - A legend template
legendTemplate : '<% for (var i=0; i- <%if(datasets[i].label){%><%=datasets[i].label%><%}%>
<%}%>
',
//Boolean - whether to make the chart responsive
responsive : true,
maintainAspectRatio : true
}
barChartOptions.datasetFill = false
barChart.Bar(barChartData, barChartOptions)
})
Gibi
- Üyelik 10.02.2018
- Yaş/Cinsiyet 26 / E
- Meslek Back-End ve Siber Güvenlik
- Konum İstanbul Avrupa
- Ad Soyad F** G**
- Mesajlar 101
- Beğeniler 11 / 1
- Ticaret 0, (%0)
hocam chart.js den alıyor. Datanın bulunduğu .js tema yapımcıları tarafından oluşturulmuş.
- Üyelik 10.02.2018
- Yaş/Cinsiyet 26 / E
- Meslek Back-End ve Siber Güvenlik
- Konum İstanbul Avrupa
- Ad Soyad F** G**
- Mesajlar 101
- Beğeniler 11 / 1
- Ticaret 0, (%0)
Konuyu hortlatıyorum fakat, projeye tekrar döndüm.
Hocam şöyle diyeyim aşağıda linkini verdiğim temayı kullanıyorum. Buradaki temada bulunan tabloyu kullanmak istiyorum.
https://demos.creative-tim.com/argon-dashboard/index.html
Hocam şöyle diyeyim aşağıda linkini verdiğim temayı kullanıyorum. Buradaki temada bulunan tabloyu kullanmak istiyorum.
https://demos.creative-tim.com/argon-dashboard/index.html
Konuyu toplam 1 kişi okuyor. (0 kullanıcı ve 1 misafir)